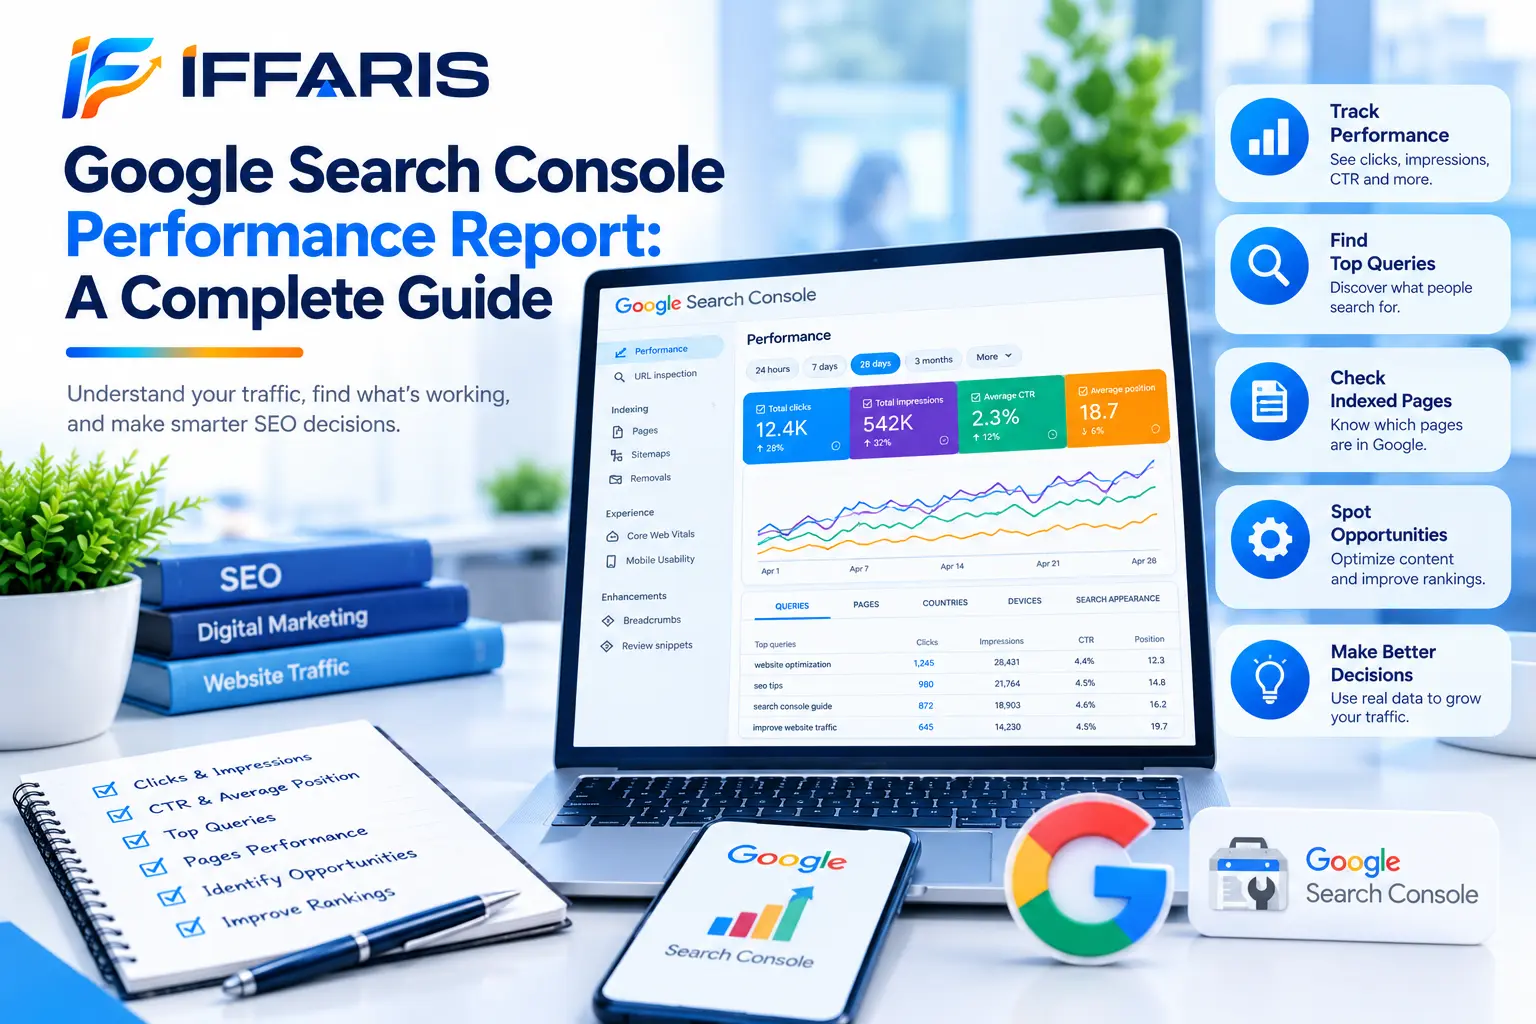
If you want to know how your website actually performs in Google Search, there is one place that answers the question with real data straight from the source. The Google Search Console performance report shows which queries bring people to your pages, how often your listings appear, how many visitors click, and where you rank. No third-party estimate comes close to that level of accuracy.
Yet many site owners open the Google Search Console performance report, glance at a line chart, and close the tab without acting on anything. The Google Search Console performance report is far more useful than that. Used properly, it helps you find quick ranking wins, fix pages that attract impressions but no clicks, spot problems after an update, and decide what to publish next.
This guide explains everything you need to know about the Google Search Console performance report. You will learn what each metric means, how to use filters and comparisons, how to find high-value opportunities, and how to build a simple reporting routine. Whether you are a beginner or an experienced marketer, you will finish with a clear process you can repeat every month.
What Is the Google Search Console Performance Report?
The Google Search Console performance report is a free report inside Google Search Console that shows how your site appears in Google Search results. It is based on data Google records whenever your pages are shown to searchers and whenever those searchers click through.
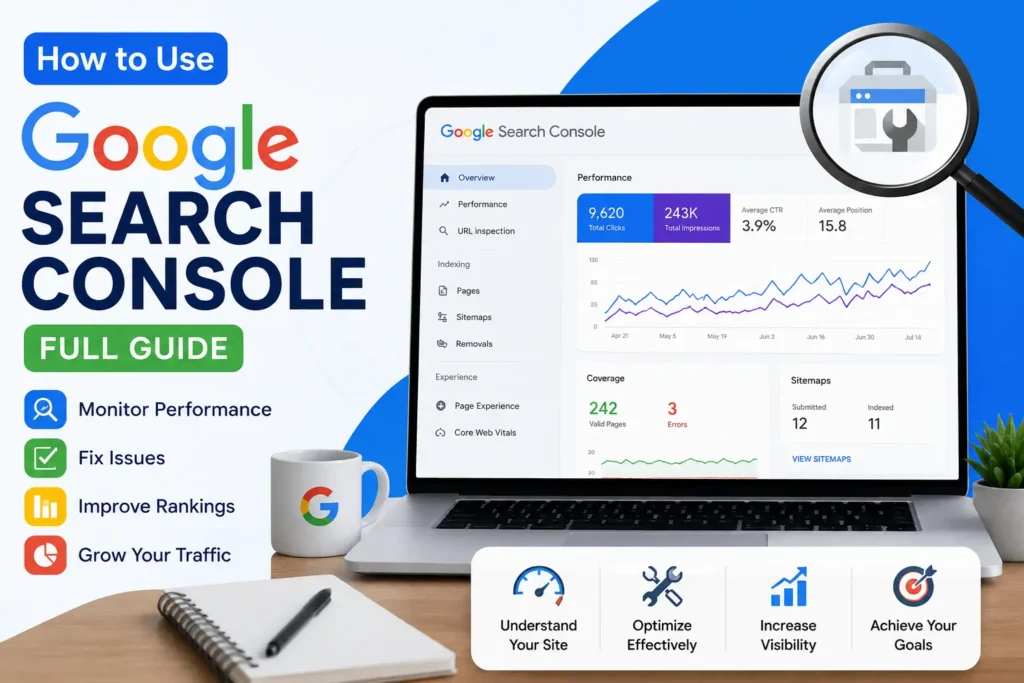
Unlike analytics tools that track what visitors do after they land on your site, the Google Search Console performance report focuses on what happens before the click. It answers questions such as:
- Which search queries trigger my pages?
- Which pages get the most impressions and clicks?
- Is my click-through rate healthy for my rankings?
- In which countries and on which devices am I visible?
- Did a recent change help or hurt my search visibility?
If you have not set up Search Console yet, begin with our guide on how to use Google Search Console. Verification takes only a few minutes, and data starts collecting as soon as your property is added. Note that Google cannot show you data from before you verified, so the sooner you set it up, the more history you will have.
Where to Find It
Sign in to Search Console, select your property, and click Performance in the left menu, then Search results. Depending on your site, you may also see separate reports for Discover and Google News. Each one has its own data and should be reviewed separately from the main Google Search Console performance report.
The Four Core Metrics Explained
Everything in the Google Search Console performance report rests on four metrics. Understanding them precisely prevents the most common misreadings.
1. Total Clicks
A click is counted when a searcher clicks a link to your site from a Google Search result. Clicks are the closest thing the report offers to organic traffic, although the number will rarely match your analytics tool exactly because the two systems count differently.
2. Total Impressions
An impression is counted when a link to your site appears in a search result that a user could see. The result does not need to be scrolled into view in every case, and the user does not need to click it. Impressions show your visibility, and they are a useful early signal when you publish new content.
3. Average CTR
Click-through rate is clicks divided by impressions, shown as a percentage. If your listing appears 1,000 times and receives 50 clicks, your CTR is 5%. CTR depends heavily on ranking position, the type of query, and how appealing your title and description are.
4. Average Position
This is the average position of your site’s highest-ranking result for the queries or pages in the selected data. A lower number is better, so position 1 is the top organic result. Average position is easy to misread because it blends many queries, devices, and locations into one number. Always look at it alongside a specific query or page rather than across the whole site.
Understanding the Layout of the Google Search Console Performance Report
The report has four main areas.
The chart. At the top, a line graph plots your selected metrics over time. Click the metric tiles above the chart to toggle each on or off.
The filter bar. Above the chart, you can set search type, date range, and add filters for queries, pages, countries, devices, and more.
The dimension tabs. Below the chart, tabs break your data down by Queries, Pages, Countries, Devices, Search appearance, and Dates.
The data table. The rows under each tab show your numbers for each query, page, or other dimension and can be sorted by any column.
Switching between tabs while applying filters is how you uncover insights. For example, filter by a single page, then open the Queries tab to see exactly which searches lead to that page.
How to Use Filters in the Google Search Console Performance Report
Filters turn a general overview into targeted analysis. Here are the most useful ones.
Search Type
By default, the Google Search Console performance report shows web search results. You can switch to Image, Video, or News to see data for those result types. If you publish original images or video, check these separately.
Date Range
You can view the last 7 days, 28 days, 3 months, 6 months, 12 months, or 16 months, or set a custom range. Sixteen months is the maximum history Search Console keeps, so export key data regularly if you want long-term records. Longer ranges smooth out daily noise and let you compare year-over-year seasonality.
Compare Mode
Comparison lets you set two date ranges side by side, such as the last 28 days versus the previous 28 days, or this month versus the same month last year. It is the fastest way to see what changed after a site update, content refresh, or algorithm shift.
Query and Page Filters
You can filter to queries containing certain words, queries that match exactly, or queries that do not contain a term. Page filters work the same way. Custom regular expression matching is also available, which is helpful for grouping all pages in a folder or all queries that include a question word.
Country and Device Filters
Country filters show where your visibility comes from. Device filters split data between desktop, mobile, and tablet. Differences between devices can reveal mobile usability or speed problems that deserve attention.
Search Appearance
This filter shows data for special result types your site qualifies for, such as rich results or other enhanced listings, depending on your markup and content.
What Is a Good CTR in the Google Search Console Performance Report?
There is no single good CTR, because it varies by position, intent, and result layout. As a rough guide, listings in the first position tend to earn a far higher CTR than listings at the bottom of page one, and CTR drops steeply on page two. Branded queries usually have much higher CTR than generic ones, since people searching your name already want you.
Instead of chasing a universal benchmark, compare pages against your own site. In the Google Search Console performance report, sort pages by impressions and look for ones with a CTR well below your typical rate at a similar position. Those pages are the best candidates for title and description improvements.
Practical Ways to Use the Google Search Console Performance Report
Now for the actionable part of the Google Search Console performance report. These are the workflows that deliver the most value.
1. Find Quick Win Keywords in Striking Distance
Queries where you rank between positions 8 and 20 are in striking distance of the top results. To find them:
- Open the Queries tab and set a date range of at least 3 months.
- Sort by impressions.
- Look for queries with solid impressions and an average position between 8 and 20.
- Click each query to see which page ranks for it.
- Improve that page by adding depth, updating information, strengthening headings, and adding internal links.
Because these pages already rank somewhere, modest improvements can lift them onto the first page. This is often the highest-return use of the Google Search Console performance report. Our on-page SEO checklist gives you a structured way to review each page you choose.
2. Fix High-Impression, Low-CTR Pages
In the Google Search Console performance report, a page with thousands of impressions and a poor CTR is losing traffic it has already earned. Review the title tag and meta description, and compare them with competing listings. Make titles specific and benefit-driven, include the main keyword naturally, and write descriptions that promise a clear answer. Test one change at a time and use compare mode a few weeks later to measure the effect.
3. Discover New Content Ideas From Real Queries
Search queries in the Google Search Console performance report reveal how people really phrase their needs. Look for questions, long-tail phrases, and related topics that appear with modest impressions. Each one is a signal that searchers want content you might not have fully covered. If your research process is still developing, read our keyword research guide, and explore long-tail keywords and low-competition keywords to turn those queries into a content plan.
4. Identify Keyword Cannibalization
Sometimes several pages on your site compete for the same query, splitting clicks and confusing Google. To check, filter the Google Search Console performance report by a single query and open the Pages tab. If multiple pages appear with similar positions, consider merging them, differentiating their focus, or adding clearer internal links to your preferred page.
5. Detect Content Decay
Using the Google Search Console performance report, you can spot decay early. Over time, older pages can lose clicks as information becomes outdated and competitors publish fresher material. Use compare mode with a year-over-year range and sort the Pages tab by the change in clicks. Pages with the biggest declines are strong refresh candidates. Update statistics, add new sections, and improve examples, then monitor recovery.
6. Measure the Impact of Changes and Updates
After you publish a redesign, change URLs, update templates, or fix technical issues, use the Google Search Console performance report to confirm the results. Annotate your own calendar with the date of each change, then compare before and after periods. Remember that rankings take time to react, so judge results over weeks, not days.
If traffic drops suddenly, check whether the pattern lines up with a known Google update, a technical fault, or a site change. Pair performance data with an indexing review using the Search Console coverage report and this guide to Google Search Console indexing to see whether pages dropped out of the index.
7. Understand Mobile vs. Desktop Performance
In the Google Search Console performance report, open the Devices tab and compare clicks, CTR, and position. If mobile performance is much worse than desktop, investigate page speed, layout, and usability on small screens. Run a website speed test and review Core Web Vitals to find fixable causes.
8. Check Geographic Performance
In the Google Search Console performance report, the Countries tab shows which regions send you impressions and clicks. Local businesses can confirm they are visible where they operate. International sites can see whether content in a particular language or region is gaining traction and where there may be an opportunity to localize.
9. Evaluate Branded vs. Non-Branded Search
In the Google Search Console performance report, separate queries containing your brand name from those that do not. Branded traffic shows awareness and loyalty, while non-branded traffic shows how well you attract new audiences. A healthy site grows both. If non-branded clicks are flat, your content and link strategy deserves attention.
10. Support Local and Service Business SEO
Local businesses can use the Google Search Console performance report to see which service and location phrases drive visibility, then build service pages and supporting content around the best ones. For a deeper process, the local SEO audit guide shows how to connect Search Console data with other local ranking signals.
Reading the Google Search Console Performance Report Without Misleading Yourself
Data from the Google Search Console performance report is only useful if you interpret it correctly. Keep these cautions in mind.
- Data is delayed. The most recent day or two may be incomplete, so avoid judging results too early.
- Some queries are hidden. Google anonymizes rare queries to protect user privacy, so totals can exceed the sum of visible rows.
- The table shows limited rows. The interface shows a capped number of rows, so use exports or the API for large sites.
- Average position blends contexts. One number can hide big differences between queries, locations, and devices.
- Impressions can rise without traffic. Better visibility on queries with low CTR will not always create visits.
- Totals will not match analytics. Different tools measure different things, so look at trends rather than exact matches.
- Search features change. New result layouts, including AI-generated summaries, can change click behavior. Check Google’s current documentation to see how those features are counted in your data.
A Worked Example: Turning Report Data Into Action
Imagine a small plumbing company with a service page that targets “water heater repair.” In the Google Search Console performance report, the owner filters by that page and opens the Queries tab. The page earns 6,000 impressions over three months but only 90 clicks, a CTR of 1.5%. The average position is 11.4.
Two problems stand out. First, the page ranks just below the first page, so most searchers never see it. Second, among the queries it does appear for, several are questions such as “how much does water heater repair cost” and “why is my water heater leaking,” which the page does not answer.
The owner makes three changes: adds a pricing section and a short troubleshooting FAQ, rewrites the title tag to mention same-day service, and links to the page from three related blog posts. Four weeks later, compare mode in the Google Search Console performance report shows impressions up 40%, average position at 8.2, and clicks more than doubled.
This is the pattern to repeat. The Google Search Console performance report points you to a specific page and query, the data suggests a cause, you make a targeted improvement, and the report confirms whether it worked. Small, evidence-based steps like these add up faster than broad, unfocused rewrites.
Exporting and Sharing the Google Search Console Performance Report
You can export the Google Search Console performance report to Google Sheets, Excel, or CSV from the export button at the top right of the page. Exporting is important for three reasons: it preserves data beyond the 16-month limit, it lets you build custom analysis, and it makes reporting to clients or teams easier.
For larger sites, consider connecting Search Console to Looker Studio for dashboards, or using the Search Console API or BigQuery export for deeper analysis. These options remove row limits and let you combine Search Console data with analytics, conversion, and revenue data.
Build a Simple Monthly Routine Around the Google Search Console Performance Report
A repeatable routine makes the Google Search Console performance report part of your workflow instead of a one-time check. Here is a practical schedule.
Weekly (10 minutes):
- Check the last 7 days against the previous 7 days for sudden changes.
- Scan the Pages tab for new posts and see whether they are gaining impressions.
Monthly (45 minutes):
- Compare the last 28 days with the previous 28 and the same period last year.
- List the top gaining and losing pages and queries.
- Identify five striking-distance queries to improve.
- Pick three high-impression, low-CTR pages for title and description tests.
- Export the data and save it in a tracking sheet.
Quarterly (2 hours):
- Review device and country trends.
- Audit content decay and plan refreshes.
- Check for cannibalization across your main topics.
- Revisit your content plan using new query data. Our SEO strategy guide shows how to turn these findings into a roadmap.
Connect the Performance Report to the Rest of Your SEO
The Google Search Console performance report works best alongside other parts of your SEO workflow.
- Indexing: if a page has no impressions at all, confirm it is indexed. Use URL Inspection and the indexing reports before assuming a ranking problem.
- Technical health: unexpected drops can come from crawl, speed, or markup issues. Keep a technical SEO checklist handy.
- Crawl control: make sure you are not blocking important pages. Review how robots.txt for SEO rules affect crawling.
- Links: a rise in impressions after earning strong links shows your off-page work is paying off. See how to get backlinks for safe approaches.
- Foundation: if the basics still feel unclear, review what is SEO and how Google Search works.
- Wider audits: use this SEO audit checklist to pair performance insights with a complete site review.
Common Mistakes When Using the Google Search Console Performance Report
- Looking only at total clicks: the real insight is in queries, pages, and comparisons.
- Ignoring CTR: low CTR at good rankings is a fixable problem.
- Judging position as one site-wide number: always check it by query or page.
- Overreacting to daily changes: normal fluctuation can look like a trend in short windows.
- Not saving historical data: you lose anything older than 16 months.
- Chasing every query: focus on queries that match your goals and audience.
- Making many changes at once: it becomes impossible to know what worked.
- Skipping annotations: record the date of every major change so you can explain later movements.
Quick Checklist for the Google Search Console Performance Report
- Property is verified and the correct property type is selected.
- You have reviewed clicks, impressions, CTR, and position together.
- You compared at least two date ranges.
- You checked top queries and top pages.
- You found striking-distance and low-CTR opportunities.
- You reviewed device and country differences.
- You exported the data for your records.
- You recorded what you will change and when.
Frequently Asked Questions
What is the Google Search Console performance report used for?
It shows how your site performs in Google Search, including clicks, impressions, average CTR, and average position, broken down by query, page, country, device, and more. SEOs use it to find opportunities, diagnose drops, and measure results.
How often does the Google Search Console performance report update?
Data is typically updated daily with a short delay, often a day or two. Recent days may be incomplete, so wait before drawing conclusions.
Why do my clicks in Search Console differ from Google Analytics?
The tools measure different events. Search Console counts clicks in Google Search results, while analytics counts sessions on your site, which can be affected by consent settings, redirects, and tracking differences.
How far back does the Google Search Console performance report go?
It keeps up to 16 months of data. Export regularly if you want a longer history.
Why are some queries missing from the Google Search Console performance report?
Google anonymizes certain rare queries for privacy. They still count in your totals but do not appear as individual rows.
What is a good average position in the Google Search Console performance report?
Positions 1 to 3 typically earn the most clicks, and the first page covers roughly positions 1 to 10. But always judge position by query and intent rather than by a single site-wide average.
Can I use the Google Search Console performance report for local SEO?
Yes. Filter by location-related queries and pages to see how service and city pages perform, and use country and device data to understand your audience.
How do I get more clicks from the same impressions?
Start with the Google Search Console performance report to find weak listings, then improve titles and meta descriptions, match search intent more precisely, add helpful structured data where appropriate, and strengthen content so it earns higher positions.
Conclusion
The Google Search Console performance report is one of the most valuable free resources in SEO. It reveals how real people find your site, which pages deserve attention, and where small improvements can produce meaningful gains. The key is to move beyond glancing at totals and use filters, comparisons, and a regular routine to turn data into decisions.
Start with this simple plan: open the report today, set the date range to the last three months, and sort queries by impressions. Pick one striking-distance query, one low-CTR page, and one declining page, and make a focused improvement to each. Check the results in a few weeks using compare mode, and repeat. Consistent, data-led action is what makes the Google Search Console performance report a growth tool rather than just a dashboard.